Diffraction gratings are often used as a tool for bending and spreading light in optical instruments. Analyzing the diffraction efficiency of such optical components is important, as this can affect the instrument’s performance. Simulation offers an efficient way for testing various grating designs to achieve an optimal configuration. By creating a simulation app, you can further expedite this process, extending simulation capabilities to a wider audience. Our Plasmonic Wire Grating Analyzer demo app highlights this approach.
Designing with Diffraction Efficiency in Mind
Take a CD in your hand. As the sun reflects off it, point the CD at a white wall. As you look at the wall, you will notice that a color reflection appears. What you are seeing is a result of small pits on one side of the CD that are arranged in a spiral. This is just one everyday example of diffraction grating.

Image by Luis Fernández García – Own work, viaWikimedia Commons.
Often utilized in monochromators and spectrometers,diffraction gratingsare optical components with a periodic structure that reflects and transmits different wavelengths of light in different directions. The spacing and structure of the grating determines the directions and the relative magnitudes of the reflection and transmission. This reflection and transmission is also a function of the wavelength as well as the angle of incidence of the incoming light. As such, it is important that the grating is configured to ensure proper diffraction efficiency and thus enhance the overall performance of the optical instrument.
Testing different grating configurations can be costly and time consuming when done experimentally. Instead, simulation is a more cost-effective and efficient approach to achieving the optimal design. This virtual testing environment provides greater flexibility in analyzing different design scenarios, while eliminating costs associated with having to build prototypes to analyze each new modification.
With the Application Builder in COMSOL Multiphysics, you can now further simplify your simulation process by creating an easy-to-use app. Customized to fit your own design needs, simulation apps can be distributed throughout your organization, enabling others to run their own simulation tests. Our Plasmonic Wire Grating Analyzer demo app offers a helpful foundation for building an app of your own.
Using a Simulation App to Analyze a Plasmonic Wire Grating
Let’s begin by discussing the model underlying the app. In the model, an electromagnetic wave is incident on a wire grating on a dielectric substrate. The example is designed for one unit cell of the grating, with Floquet boundary conditions used to describe the periodicity.
ThePlasmonic Wire Grating Analyzer demo apptakes the physics and functionality behind this model and makes it available in a simplified format. With this app, users can easily compute diffraction efficiencies for the transmitted and reflected waves as well as the first and second diffraction orders as functions of the angle of incidence. Additionally, this simulation app enables visualization of the electric field norm plot for various grating periods for a specific angle of incidence.

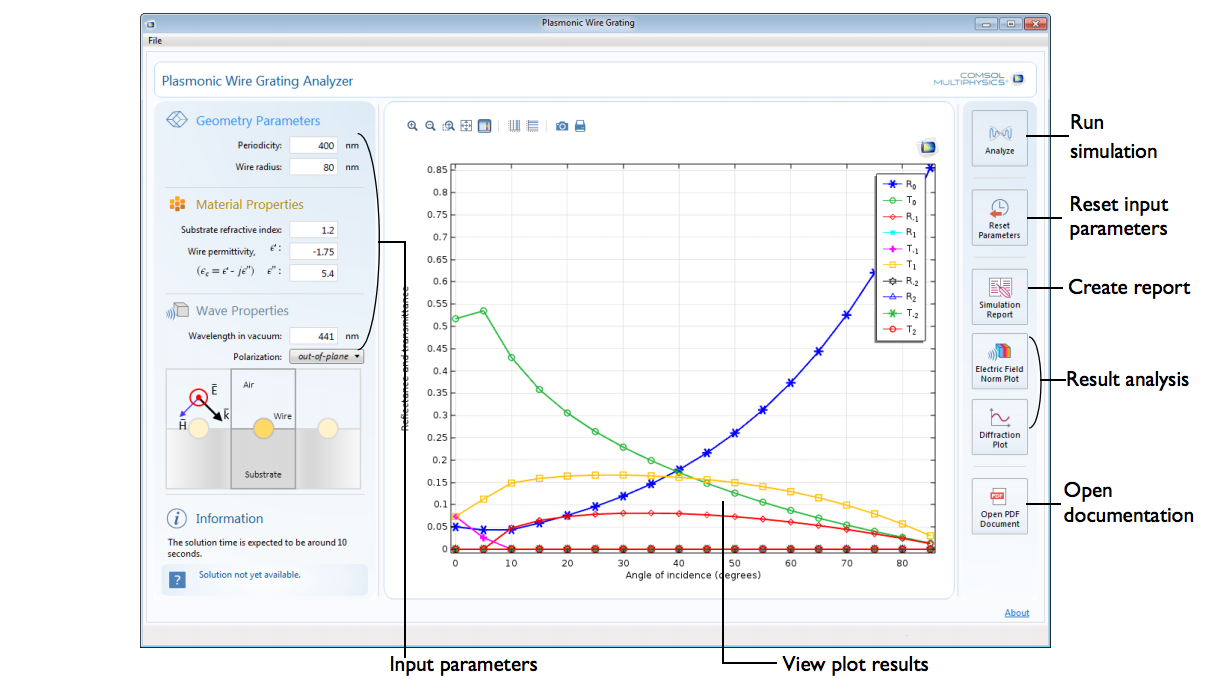
A diffraction efficiency plot shown in the app.
The figure above provides an overview of the app’s user interface. The left side of the interface features user-defined parameters, which are broken down into four different sections. The radius of a wire and the periodicity can be defined in theGeometry Parameterssection, with the relative permittivity of the wire grating and the refractive index of the substrate arranged in theMaterial Propertiessection. The wavelength and the orientation of polarization are indicated in theWave Propertiessection, and the current status of the app is referenced in theInformationsection.
Looking to the right side of the interface, there is a command toolbar comprised of six buttons —Analyze, Reset Parameters, Simulation Report, Electric Field Norm Plot, Diffraction Plot,andOpen PDF Document. In their respective order, these buttons enable app users to run the simulation, revert input parameters back to their default values, make a simulation report, plot the electric field norm and the diffraction efficiency, and open the documentation. All results can be visualized within the graphics window in the center of the app’s interface.
When designing your own app, you can customize the look and feel of the user interface to fit your simulation needs. By including only those parameters and features that are relevant to your analysis, you can help hide the complexity of your model and create a user-friendly experience for app users.
Concluding Thoughts
Simulation apps offer a revolutionary approach to design that prompts greater involvement in the simulation process and thus delivers faster results. In the case of a wire grating, building an app simplifies the analysis of diffraction efficiencies, helping to identify a grating configuration that offers the optimal efficiency for its dedicated use. We encourage you to use our Plasmonic Wire Grating demo app as a resource in developing your own app.
Try It Yourself
- Download thePlasmonic Wire Grating Analyzer demo app


Comments (0)