In a previous blog post we dealt with thereaction kinetics and modeled plug flow of a monolithic reactorin the exhaust system of a car. The goal was to determine the ideal dosage of ammonia to reduce the nitrogen oxide levels emitted into the air. After understanding the chemistry of our problem, it is now time for the second part in our “Modeling Chemical Reactions” blog series. Here, we will go through the steps of generating a 3D model of our monolith reactor to determine the ideal size and design of our system.
Recap of Kinetics and Plug Flow
First let’s bring you up to speed on where we left off in thelast blog post. We have now analyzed the reaction kinetics of nitrogen oxide (NO) reduced by ammonia (NH3) to determine the ideal working conditions for the reduction to take place. We generated plots that gave us a good indication of the range of NH3:NO ratio, but we wanted to be more specific than that. Next, we used a plug flow model to figure out what the least amount of NH3we would need in order to reduce the NO. Our model suggested an NH3:NO ratio of 1.3.
Building a 3D Model of a Monolith Reactor
We noted that reaction kinetics, and thereby the optimal ammonia dosage, would vary depending on the temperature and that this in turn depends on the over-all design of the reactor. Let’s create a full 3D model of our monolithic reactor to find out what our air-purifying system will look like. Doing so, we will be able to understand the full space-dependency aspect of the problem. At the end of our simulation we will have either confirmed our dosage or adjusted it accordingly. Our full 3D monolith reactor model will include mass transport, heat transfer, and fluid flow.
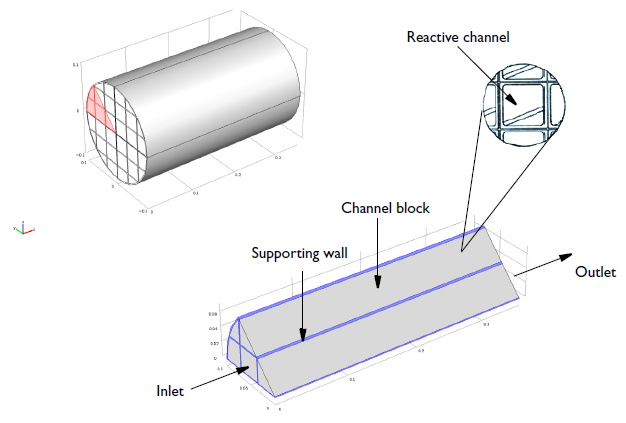
Here’s a visual of our reactor:

Geometry of a 0.36-meter-long monolith reactor with a 0.1-meter radius. Each reactive channel has a cross-sectional area of 12.6 millimeters2and the void fraction of a channel block is 0.75.
The NO reduction chemistry occurs in the channel blocks, with supporting and impermeable walls between blocks of the channels. The modeling domain is reduced to 1/8 of the full monolith reactor geometry thanks to symmetry.
Assumptions About Our Model
Let’s take a pseudo-homogeneous approach to modeling the multitude (hundreds) of channels in the reactor. Each channel will be described by 1D mass transport equations because no mass is exchanged between the channels. Let’s also assume fully developed laminar flow in the channels. That way, the average flow field is proportional to the pressure difference across the reactor. Mass and energy are transported by fluid flow in the channel direction only. The temperature of the reacting gas in the channels as well as the conductive heat transfer in the monolith structure and supporting walls are described by an energy equation. This equation happens to be what “seals the deal” in terms of connecting the reactor channels and turning this into a 3D model. This is because the temperature affects both the reaction kineticsandthe density and viscosity of the reacting gas.
Results
After defining our physics and setting up the problem we can analyze our results.
 |
 |
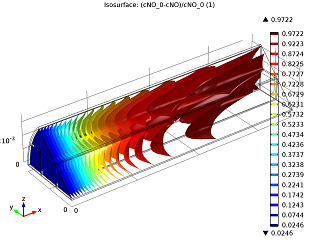
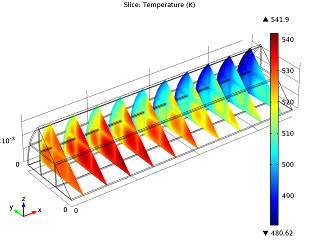
| Conversion of NO in the monolith reactor. | Cross-sections of the reactor temperature. |
In the image to the left you can see that the average NO conversion at the outlet is somewhat lower than as simulated in our single-channel model described in the previous blog post (97.5% as opposed to 98.7%). This shows us how the performance of a channel depends on its position in the reactor — it’s definitely a 3D problem. Meanwhile, the right-hand plot depicts cross-sections of the reactor’s temperature throughout. The central and inlet parts of the reactor show higher temperatures due to the exothermic reactions, but as we get further into it, we note lower temperatures due to a diminishing amount of chemical reactions that are occurring, and through heat loss into the surroundings. Again our 3D model shows slightly different results than our single-channel model: the maximum temperature here is 541.5 K versus 533.9 K in the single-channel version. The supporting walls’ thermal conductivity has an effect on the max temperature of our system.
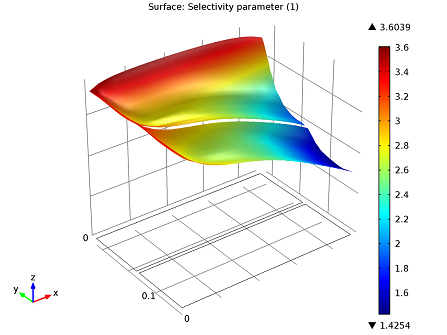
Since we know from our kinetics analysis that temperature influences the dosage, we should look at a selectivity plot to determine the appropriate dosage.

Selectivity plot: r1/r2 is greater than 1. Selectivity favors our initial dosage of ammonia.
Although we can see here that selectivity falls off close to the center of the reactor, NO is still reduced throughout the system.
TIP: Want to build this model? You can access model files and documentations for themonolith reactor modelin our Model Gallery.
Advantages of Modeling Chemical Reactions Sequentially
Breaking up our simulation process into smaller steps (kinetics, plug flow, detailed 3D model) is advantageous. The first two steps outlined in our previous blog post are relatively easy to set up, and we arrived at a well-defined problem to model in full-scale. That takes some of the pressure off the more advanced and computational-heavy 3D simulation. We also learned how temperature and space-dependency influence our model during the first steps, enabling us to set up the full model more efficiently than we would have without this knowledge. Moving from perfectly mixed conditions to full space-dependency furthermore helped us decide on the desired level of detail in our full model.
Conclusion and Next Steps
Now we’ve confirmed the ammonia dosage for our system as well as how the monolith reactor will operate in full scale. This is great, but what about other physics? It’s likely that other physics will have an effect on the performance of the catalytic converter. To find out, our next step will be to analyze the thermal stress of the reactor. Stay tuned!


Comments (4)
ComsolRaff
May 8, 2013Thank you for this excellent tutorial!
If the solid matrix’s porous how could we simulate the flow trough it?
Fanny Griesmer
May 8, 2013 COMSOL EmployeeHappy to hear you liked it.
The model does not assume that the matrix is made up of porous media. It assumes that it is a system of ‘honeycomb’ type channels. Therefore, the model solves for 1D laminar flow in the channels, and assumes that mass transport does not occur in the lateral directions. Yet, you can model Darcy’s Law, and Brinkmann’s extension to Darcy’s Law, in COMSOL, if your system was porous. There is even an interface for modeling the transfer from free channel to porous media flow.
Mike burda
July 9, 2017@ Fanny Littmarck
nice blog.
Just a short question about the annotations that you have drawn in the visual. Have they been drawn in Comsol ?
Fanny Griesmer
July 28, 2017 COMSOL EmployeeHello Mike,
Thank you for your comment. No, the annotations in that particular visual were added outside of the COMSOL Multiphysics software.