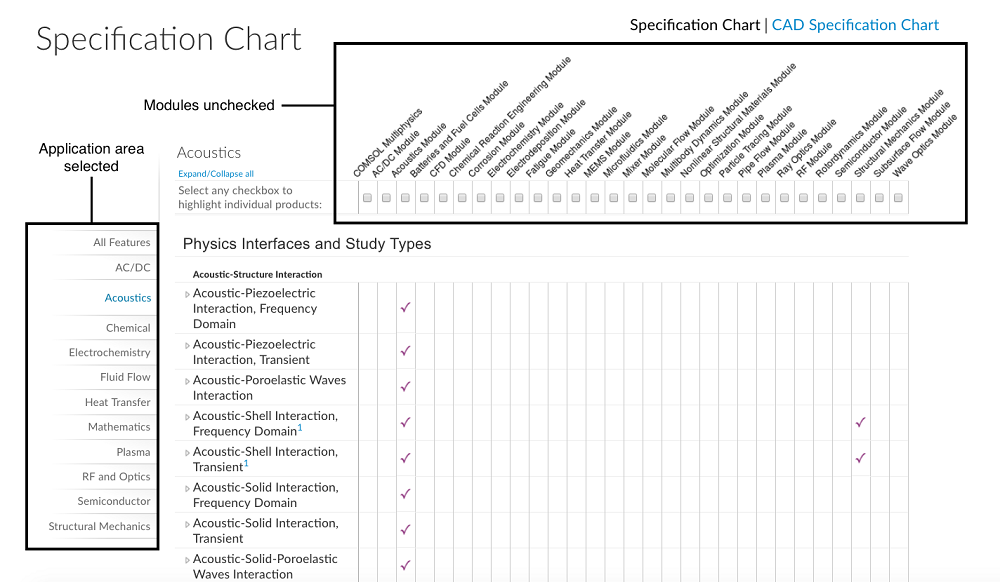
It should be as easy as possible to find the tools you need in the COMSOL® software so that you can spend more time using it to understand, predict, and optimize your engineering designs. This is where the Specification Chart comes in.
You’re One Step Closer to Solving Your Engineering Problems
Formatted in a pivot-table fashion, there are two ways you can browse theSpecification Chart. The left-hand column is organized from the perspective of different application areas. Selecting one of these tabs will narrow down your scope to a particular application and display the features and capabilities across the COMSOL Multiphysics® software and add-on products for the application you selected. This is useful if you know which application area you will be working in, but are not sure of which tools provide the best solution to your problem.
You can also choose to displayAll Featuresand select any combination of products across the list at the top. Doing so will highlight the columns, providing you with a view of what each of the products can do in a given application area. Of course, you could also combine both methods by selecting an application areaandhighlighting specific products.
As we update the COMSOL® software with new products and features, the Specification Chart is updated as well. Go ahead and find what you need for your unique engineering simulation problem with theSpecification Chart.
(We also have a separateCAD Specification Chart!)


Comments (0)