
The Application Builder in the COMSOL Multiphysics® software is used to design the graphical user interface of your simulation apps. By using layout templates, you can streamline the app design workflow. These templates guide you through the initial setup of the app and you still have the option to include your own functionality. In this blog post, you will learn how to use layout templates.
By using Layout Templates, we will create two versions of an app simulating a busbar.
Organizing the Embedded Model
Note that before applying a layout template to an app, we must first create a model in the Model Builder in COMSOL Multiphysics. To demonstrate the process, we will use theElectrical Heating in a Busbarmodel included in the Application Libraries.
To follow along with this example, start the Microsoft® Windows® version of COMSOL Multiphysics and selectApplication Librariesfrom theFilemenu. Browse toCOMSOL Multiphysics>Multiphysicsand double-click onbusbar.
Let’s make a small adjustment before creating the app. In the Model Builder, expand theResults>Temperature (ht)node, then selectSurface. In theSettingswindow forSurface, expand theRangesection and uncheckManual color range. (Since the finalized app will let the app user define the input parameters, the maximum and minimum values for the color range cannot be fixed to certain values.)
Using Layout Templates
We can now start creating the app by clicking theApplication Builderbutton in theHomeribbon tab in the Model Builder.
To create a graphical user interface, you need at least oneform object. By clicking theNew Formbutton in the ribbon, we are presented with a window where we can select among predefined templates. TheBasictemplate is the classic way to create a form, where inputs and outputs, graphics, and buttons can be placed anywhere in the user interface. TheBlank formoption gives you an empty form without any contents.
The layout templates, on the other hand, provide many additional benefits, including:
- More specific content groups and locations
- Easier creation of structured interfaces
- Automatically resizable apps
- Easier inclusion of more sophisticated form objects, such as form collections, ribbon menus, andFilemenus
- Adjustable templates to fit specific screen sizes
Let’s select the template calledRibbon, sections, and graphics. The image and description in theSelect Templatewindow, shown to the right in the image below, give an example of how the layout will look and shows the different form objects that will be included.

Selecting one of the templates when creating a new form.
Next, click theContentbutton. For this specific template, we can select to includeRibbon buttons,Inputs, andOutputsas parts of the user interface.
When theRibbon buttonstab is selected, double-click on the available items in the tree to the left or select one or multiple items and then click theAdd Selectedbutton. We can also remove items by selecting the item in the list to the right, and then clicking theRemove Selectedbutton. ThePreviewto the right is immediately updated to provide instant feedback on the app design.

A template has been selected and buttons have been added to the ribbon. ThePreviewinstantly shows the corresponding user interface.
Next, select theInputtab. The inputs added will be joined into a section of a form collection. Note that we can add multiple sections to a form collection too. For instance, maybe we would like to have one section that defines the geometry and another one for the physics.
To create the geometry section, start by selecting the geometry parametersL,rad_1,tbb, andwbb, corresponding to length, radius, thickness, and width, respectively, and then click theAdd Selectedbutton. In theNew Formdialog, change theTitletoGeometryand theNametoinputGeometrySectionand clickOK.
To create a second section, click theAdd Formbutton that is located below the list of selected items. In theNew Formdialog, change theTitletoPhysicsand theNametoinputPhysicsSection. Then double-click on thehtcparameter followed by theVtotparameter. These parameters represent the heat transfer coefficient and voltage, respectively.

Multiple sections can be added to a form collection.
Select theOutputtab and double-click onVolume Maximum 1underDerived Values. Change theTitletoResultsand clickOK. This will display the maximum temperature in the busbar.
We have now performed all of the necessary steps. The preview should look like the screenshot below before clickingDone.

A screenshot from the final step when creating an app from a template.
After selecting theDonebutton, we are taken to the Application Builder window. Try the app by selecting theTest Applicationbutton in the ribbon.
The design of the app when the template steps have been finalized.
Editing the App Created by the Layout Template
With a few simple steps, we have a fully functional app that is resizable. We can now continue to edit the app and improve the design. Compared to the initial design, we may consider changing:
- Icons and the text of the buttons that visualize the temperature and the current density
- Whether to visualize a solution after it has been computed
- Whether to show the geometry in the graphics when the app is started
- Text labels for the results
- Alignment of the input fields for the different sections
Let’s first have a look at the general layout of the app. By double-clicking on the main form in theFormsnode, you will see that themainform is divided into three parts.

Themainform created by the layout template is divided into three parts; two form collections with sections to the left and graphics to the right.
In the top left, we have a form collection containing two sections:
- inputGeometrySection
- inputPhysicsSection
Those sections were defined when we went through the initial steps using the selected layout template. Below the first form collection, we have a second form collection that contains theoutputSection1form. The graphics are updated by clicking any of the buttons in the ribbon.
The ribbon menu contains two buttons to visualize the results. They both have the same icon, but it’s easy to change the icons to something more appropriate. Start by selecting the ribbon buttonTemperature (ht)in the Application Builder tree. We can find it in the following path:Main Window>Ribbon>Home>Main. In theSettingswindow, change theTexttoTemperature. Then click the buttonAdd Image to Library and Use Here(the button with a + sign). By default, this will point us to the directory where icons are stored, typically:C:\Program Files\COMSOL\COMSOL56\Multiphysics\data\images.
In this directory, double-click on the image namedmodnav_heattransfer_32.pngto change the icon. At the same time, we can also add aTooltipto the button.Visualize the temperatureis a good description of the command. Repeat the procedure for theCurrent Densityribbon button, but this time, select the imagemodnav_acdc_32.pngand set theTooltiptoVisualize the current density.

The settings for ribbon buttons can easily be changed and adapted to the specific command to run.
When clicking theComputebutton in the app,Study 1in the embedded model is computed. When theComputebutton has been clicked, we would like to visualize a result plot immediately after the computation is finished. This can be achieved by adding a plot command to the sequence when computing the solution. Select theComputenode located inMain Window>Ribbon>Home>Mainin the Application Builder tree. In theChoose Command to Runsection in theSettingswindow, selectTemperature (ht), located underModel>Results. When selected, press thePlotbutton and the command will be added to the sequence.
We also need to add information about where we are going to visualize the temperature plot. This is done by clicking theEdit Argumentbutton at the bottom of theSettingswindow. In theEdit Argumentdialog box, selectgraphics1in themainform and clickOK.
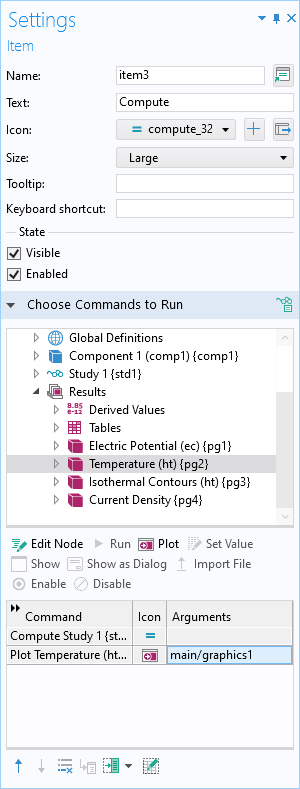
A command to plot the temperature is added to the command sequence when a solution has been computed. Note that an argument is added to define in which graphics the plot is going to be visualized.
When starting the app, you might notice that theGraphicswindow is empty. For an improved user experience, we would like to visualize the geometry at the start. We can do that by first selectinggraphics1in themainform. In theSettingswindow forGraphics, selectGeometryin theSource for Initial Graphics Contentsection and click theUse as Sourcebutton. The geometry will now be shown immediately when the app is started!
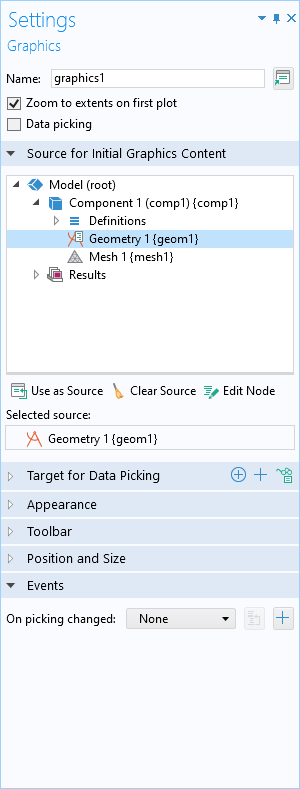
To visualize the geometry when the app is started, select theGraphicsform object in the main form and set theGeometryasSource for Initial Graphics Content.
It’s now time to test the application again to make sure our edits have improved the design.
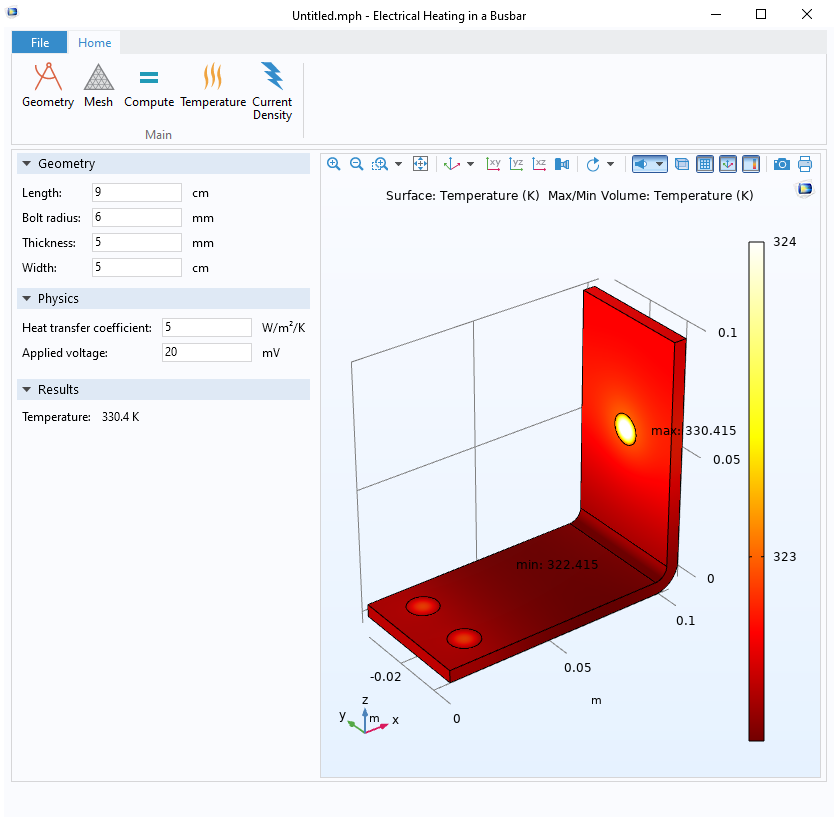
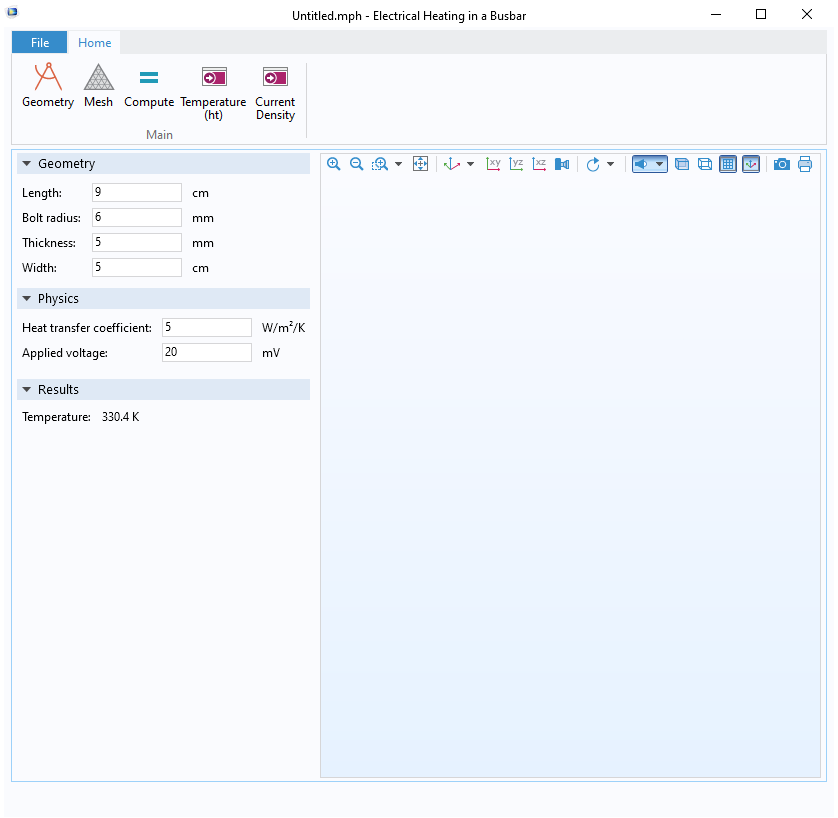
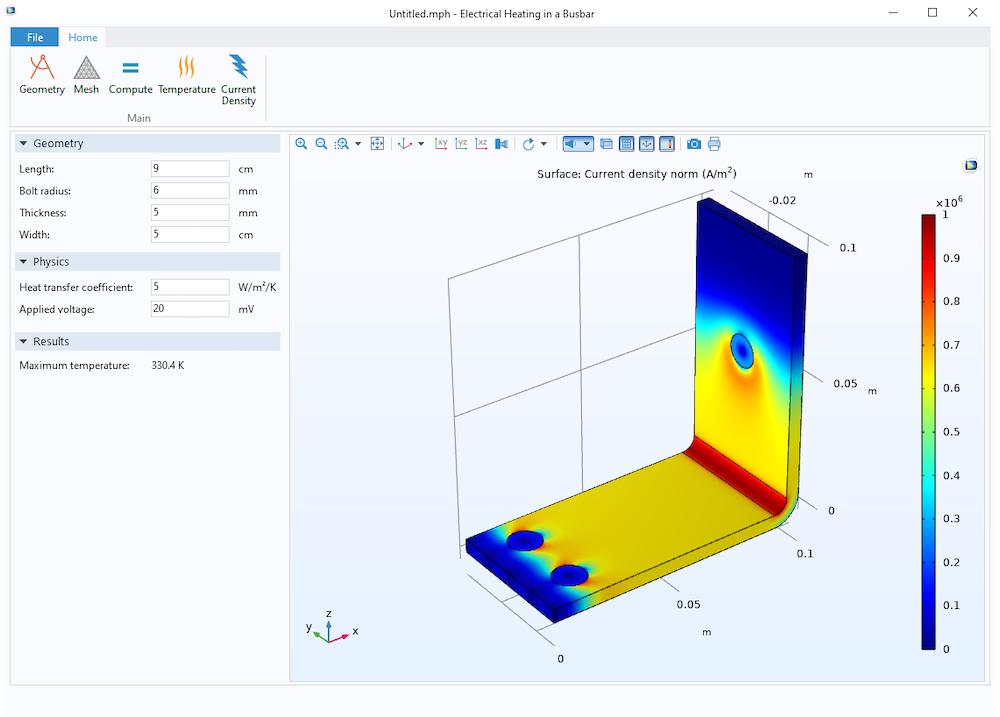
The icons and the text for theTemperatureandCurrent Densitybuttons have been changed. When the app is started, the graphics show the geometry, and when the solution is computed, the temperature plot is visualized.
By looking at the design of the app in the image above, there are still a few improvements to consider. We would like to horizontally align the input fields, and the derived value for the temperature should be namedMaximum temperaturerather than justTemperature.
Let’s start with the latter. In the Application Builder tree, double-click on the local form calledoutputSection1. It can be found in the following path:Forms>main>Forms>outputSection1. Selecttextlabel1and in theSettingswindow, change theTexttoMaximum temperature.

An app created with a template can easily be adjusted. Here, the text label for the maximum temperature is changed.
To horizontally align the input fields between the sections, start by double-clicking on theinputGeometrySectionform. Right-click on the top of the first column (with the blue background color) and selectFixed Column. Either drag the column to a specific width or set theSizeto 150 pixels in theGrid Layout for Contained Form Objectssection in theSettingswindow for theinputGeometrySectionform. You can easily reuse this layout for the other forms by usingInherit columns. Double-click on the forminputPhysicsSection. In theGrid Layout for Contained Form Objectssection in theSettingswindow, setInherit columnstoinputGeometrySection. Repeat the procedure foroutputSection1.
Finally, we would like to make the initial size of the app somewhat wider. Double-click on the main form again. In theGrid Layout for Contained Form Objectssection in theSettingswindow, setColumn 2toFixedandWidthto800. If we test the application at this stage, we will notice that theGraphicswindow is not resizable in the horizontal direction any longer. Therefore, go back to theSettingswindow for themainform and set theWidthtoGrowforColumn 2.
By editing the app generated by the layout template, we can improve the app design!
We are not limited to editing the objects included in the layout template. We can continue to add more functionality in the app and the embedded model to make the exact app we want.
Using Layout Templates Adapted to Small Screens
Some of the layout templates are adapted to fit smaller screens. With the use of COMSOL Server™, any app developed with the Application Builder can be run in a web browser, such as Safari, Firefox®, Chrome™, Internet Explorer®, and Microsoft Edge®. This makes it possible to run simulation apps on tablets and smartphones. The Application Builder has built-in support to test the applications in a web browser before they are uploaded to COMSOL Server™.
First, we start a new COMSOL Multiphysics session, and follow the instructions at the beginning of this blog post to change the embedded model. In addition, we can make some small adjustments to make the app look better with a smaller screen size.
- In the Model Builder, select theResults>Temperature (ht)node. In theSettingswindow for3D Plot Group, expand theColor Legendsection and set thePositiontoBottom. Follow the same procedure for theCurrent Densityplot group.
- Remove the axis and the axis orientation to make the graphics cleaner. In the Model Builder, select theComponent 1>Definitions>View 1node. Expand theViewsection and uncheckShow gridandShow axis orientation. At the same time, we can also checkShow material color and texturein theColorssection.
- The default font size of the plot titles can be decreased to save space and to better align with the rest of the app. Select the root node,busbar.mph, and in theGraphicssection, set theSizeto8 pt.
Let’s create an app with the layout template calledAdvanced compact layout for smartphones. Follow these steps:
- In Application Builder, select theNew Formbutton in the ribbon.
- Select the templateAdvanced compact layout for smartphones. Note the layout, form objects included in the template, and description below the image. Then clickContent.
- In theDesign buttonstab, double-clickGeometry.
- Select theDesign inputtab. Select I,rad_1,tbb, andwbb. Then click theAdd Selectedbutton and clickOKin theNew Formdialog box to keep the defaultTitleandName.
- Select thePhysics inputtab. SelecthtcandVtotand click theAdd Selectedbutton. Then clickOKin theNew Formdialog to keep the defaultTitleandName. (Note: We don’t necessarily need to add any content to thePhysics buttontab unless we want to, and we leave it empty in this example.)
- Select theSimulate buttonstab. SelectPlot Mesh 1andCompute Study 1. Then click theAdd Selectedbutton.
- Select theSimulate inputtab. Double-click onmh, then clickOKin theNew Formdialog box to keep the defaultTitleandName.
- Select theResults buttontab. SelectPlot Temperature (Ht)andPlot Current Density. Then click theAdd Selectedbutton.
- Select theResults outputtab. Double-click onVolume Maximum 1. Then clickOKin theNew Formdialog box to keep the defaultTitleandName.
- Finalize the setup by pressingDone.
It’s now time to try the app by selecting theTest Applicationbutton in the ribbon. Click on the buttons at the top (Design,Physics,Simulate, andResults) to better understand how the layout is working.
From top to bottom, themainform includes:
- Four large buttons to select a view.
- Each button calls the local methodhighlightTopMenuItemwith an argument.
- highlightTopMenuItemhighlights the selected button and the horizontal line in the top menu. It also updates the local string,activeCard, which controls the card stacks (cardstack1andcardstack2).
- Horizontal lines below the buttons, which change color depending on the currently selected view.
- A card stack (cardstack1) that shows different local forms depending on the currently selected view. The local forms contain a toolbar.
- A card stack (cardstack2) that shows different local forms depending on the currently selected view. The local forms contain input and output.
- One graphics object that is updated based on the selected command incardstack1.

The main form contains 12 local forms. The stringactiveCardcontrols the two card stacks. The Array 1D StringtopMenuButtonscontains the names of the buttons in the top menu. The local methodinitializeApplicationruns when the application is started, andhighlightTopMenuItemruns when a button in the top menu is clicked. Everything is automatically set up using the layout template calledAdvanced compact layout for smartphones.
It’s easy to edit the app created with the layout template. Similar to the app we built with the template calledRibbon, sections, and graphics, we could change the following:
- Show the geometry when the app starts:
- Double-click on themainform.
- Selectgraphics1.
- In theSettingswindow, set theGeometryas theSource for Initial Graphics Content.
- Change the icons:
- Double-click on theresultsCommandsform.
- SelectresultsToolbar.
- In theToolbar Itemssection in theSettingswindow, selectitem1and click theEditbutton.
- Change theTexttoTemperature.
- Click theAdd Image to Library and Use Herebutton and selectmodnav_heattransfer.png. (Note that we use the 16×16 pixel icon, since the toolbar uses small buttons.)
- ClickOKto close theEdit Custom Toolbar Itemdialog box.
- In theToolbar Itemssection in theSettingswindow, selectitem2and click theEditbutton.
- Click theAdd Image to Library and Use Herebutton and selectmodnav_acdc.png.
- ClickOKto close theEdit Custom Toolbar Itemdialog box.
- Change the text label for the maximum temperature:
- Double-click on theresultsOutputform.
- Selecttextlabel1and change the text toMaximum temperature.
- When clicking theComputebutton, we would like the temperature plot to be visualized by default. At the same time,RESULTSshould be highlighted and the two belonging card stacks should be activated.
- Double-click on themainform and select theRESULTSbutton in the top menu. In theChoose Commands to Runsection in theSettingswindow forresultsButton, we can see that the methodhighlightTopMenuItemis run with the argumentresults. The same command can be used after the computation is finished.
- Double-click on thesimulateCommandsform and select the toolbar. In theToolbar Itemssection in theSettingswindow forsimulateToolbar, selectitem2and click theEditbutton.
- In theEdit Custom Toolbar Itemdialog box, select theCommands to Runtab.
- SelecthighlightTopMenuItem, which can be found underForm Methods, and click theRunbutton. In theArgumentsfield, add the stringresultsas the input argument. This will move the user fromSIMULATEtoRESULTS.
- SelectTemperature (ht), which can be found underModel>Results, and then click thePlotbutton. Click theEdit Argumentbutton, and in theEdit Argumentdialog box, selectgraphics1underForms>mainand clickOK. Close theEdit Custom Toolbardialog box by clickingOK.
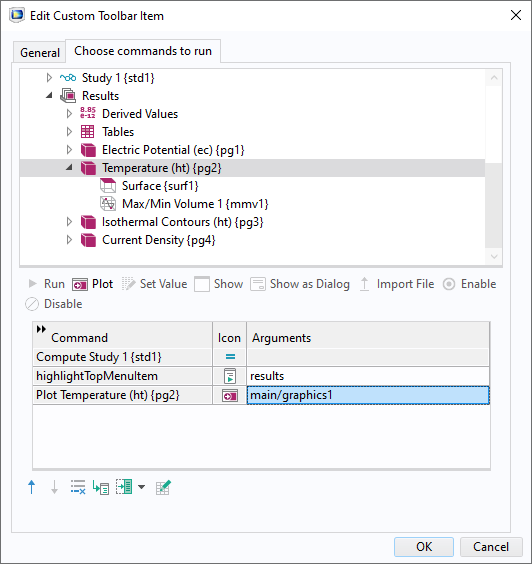
The command sequence for theComputetoolbar button is modified. When the computation is finished,RESULTSis highlighted and its two card stacks are activated. The temperature is also plotted in theGraphicswindow.
Now it’s time to retest the application. Since the user interface of this app is dedicated to small screens and web browsers, selectTest in Web Browserin the ribbon.
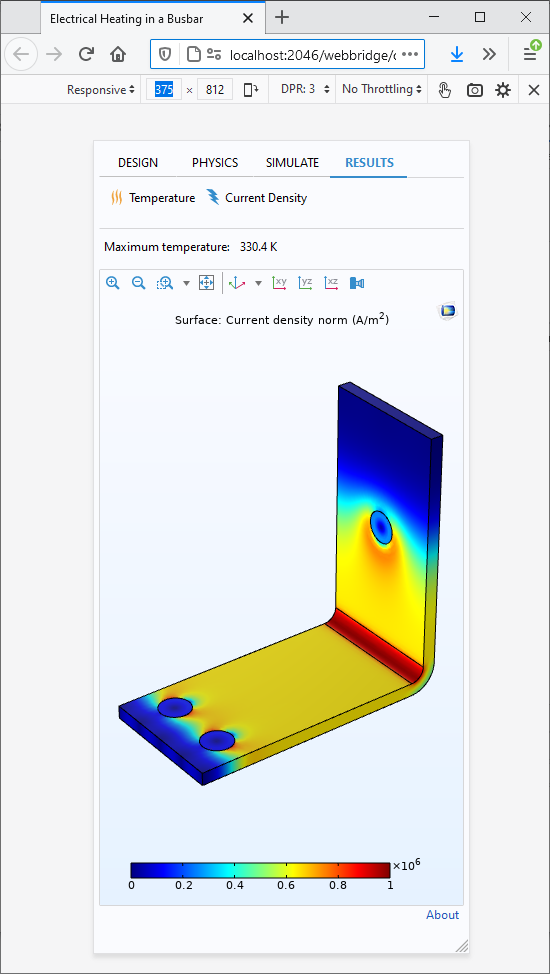
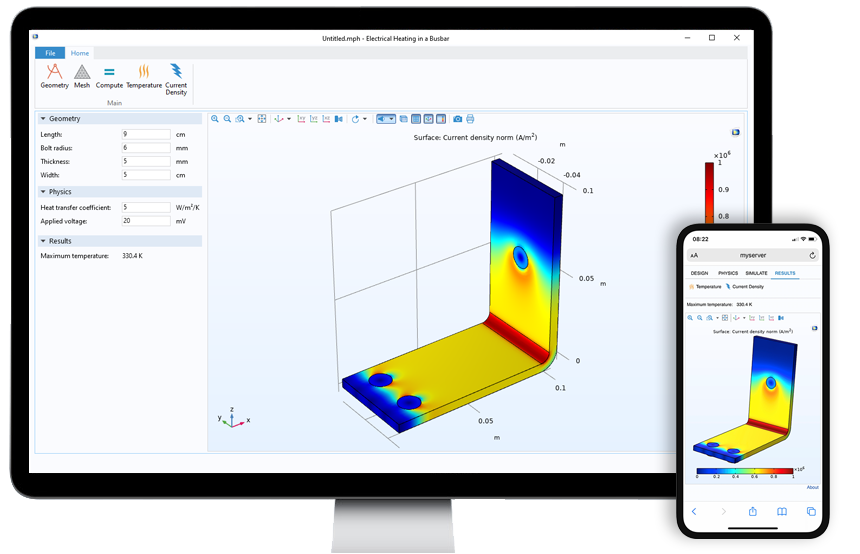
The app is tested in a Firefox® web browser after we have made some small modifications to the app produced by the layout template calledAdvanced compact layout for smartphones. Here, the screen size is set to 375 x 812 pixels, which is the viewport size of an Apple iPhone XS.
Most web browsers have support for trying webpages on different screen sizes. Using Chrome™, you can open theDeveloper tools(Ctrl+Shift+I) and select one of the predefined sizes. When using Firefox®, you can try theResponsive Design Mode(Ctrl+Shift+M) to make sure your app is adapted to fit your selected screen size.
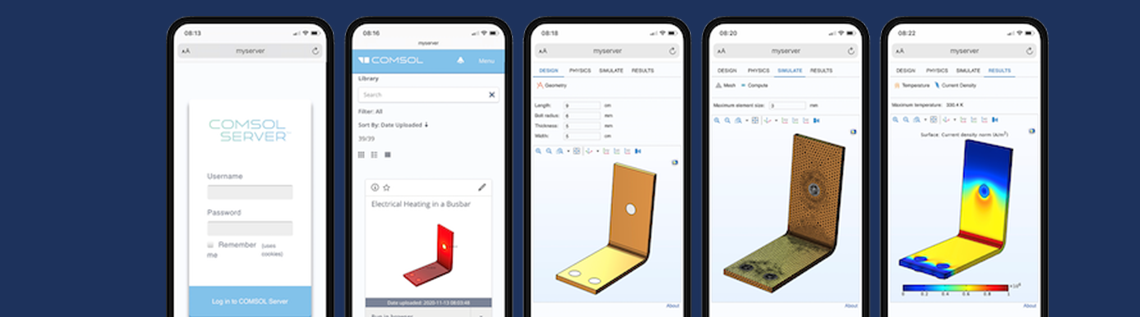
If you have access to COMSOL Server™, it’s now time to upload the app. After that, you can log into COMSOL Server™ using the web browser on your tablet, smartphone, or any other device of your choice. Run the app and you will be presented with the interface of the app that we have created with the layout templateAdvanced compact layout for smartphones.

The simulation app has been uploaded to COMSOL Server™ and is then run with a smartphone web browser.
Concluding Remarks
You now know how to use layout templates, available as of COMSOL Multiphysics version 5.6, to easily create simulation apps. Keep in mind that you are not limited to the specific design of the selected template, since you can continue to develop the app by using any of the tools included in the Application Builder.
Apple, iPhone, and Safari are trademarks of Apple Inc., registered in the U.S. and other countries.
Microsoft, Microsoft Edge, Internet Explorer, and Windows are either registered trademarks or trademarks of Microsoft Corporation in the United States and/or other countries.
Chrome is a trademark of Google Inc.
Firefox is a registered trademark of the Mozilla Foundation.

Comments (3)
MOHAMMED MIA
October 28, 2021Some simulation about photonic crystal fiber
MOHAMMED MIA
October 28, 2021Add some simulation about how to design photonic crystal fiber on COMSOL software
Telkom University
June 21, 2024What feedback does the Preview offer to the user?